NYC Context Explorer
A better way for designers to explore New York City zoning code
Roles: Product Design | UI Design | Front-End Development


Spring 2021
Time: 4 Months
Project Type: Front-End Development, UI Design
Project Team: Yiwen Che
Live Demo: Context Explorer NYC
NYC Open Data: NYC Open Data Gallery
Summary
Context Explorer NYC helps designers, architects, and citizens become more acquainted with city data. This demonstration project aims to visualize zoning and site information needed to jump-start preliminary design projects.
Technology
React
Netlify
Mapbox GL JS
ArcGIS REST API
Sources & Citation
NYC Open Data
MapPLUTO
Font Awesome
Define the Problem
NYC ZOLA has an overwhelming and unintuitive user interface, catered mostly towards government and planning professionals.
Young designers and architects have a difficult time accessing required urban data to start design projects.
This digital product exercise would provide an excellent opportunity to learn React and handle GeoJSON data.
Technical Summary
Introduction
Zoning ordinance information can be notoriously difficult to access, beyond the reach of local legal, political and development experts. NYC Open Data initiative seeks to democratize the information and allow everyday people to access information about their building, block, and neighborhood.
Inspired by the newly public information, Yiwen and I decided to build a website that would allow citizens and designers to quickly access required urban information to jump-start their development projects. Architects intimately understand the painstaking process of gathering required site information before starting any development feasibility proposal – looking through zoning codes, finding assessor maps, and identifying local transit and amenities. We believe that Open Data has the potential to streamline site research and provide a faster way to jump-start speculative projects.
NYC ZOLA User Interface, January 2022
Existing Condition: NYC ZOLA
NYC’s online map ZOLA (link) provides a feature-rich, albeit basic, way to navigate the city’s intricate zoning code. Using OpenStreetMap as a base, the online explorer utilizes a series of graphic overlays that indicate various zoning and overlay districts across the five boroughs. The interactive map also allows users to click on different districts and brings up a link to further readings on the city website.
While we both appreciated the thoroughness and depth offered by ZOLA, we found the user experience and user interface of the site to be lacking. The desktop-based application features minimal font sizes and a color scheme that harkens back to windows-based desktop applications, as opposed to a modern web app. Links to further readings, while helpful, are not integrated well into the map experience. As designers, we would have also liked to have seen more information regarding individual blocks and buildings, in addition to different zoning districts. We see ZOLA as a functional template that needed a fresher, more intuitive approach to the design and user experience.
As novice developers, we also wanted to create a functional web-based application. With some background in both JavaScript and Python, we decided to learn how to build a React-based application. We decided to use create-react-app as our boilerplate and build the site from there. For precedent, we found inspiration from a popular app from 2020, “Sidewalk Widths NYC” by Meli Harvey, which mapped out the widths of New York City sidewalks for social distancing during the pandemic. The User Interface was beautiful, modern, and simple to use.

Sidewalk Widths NYC by Meli Harvey - a notable pandemic viral sensation, 2020
Process
Ideation
Our initial idea was to create a simple web dashboard with a search box. Users would type in an address, and it would output a series of windows that featured different types of location data: Google Maps, Zoning Information (Upcodes), Climate (OpenWeather), and Local Building Codes (ICC 2015). We identified these 4 items as design “must haves” when approaching a potential building site. In the longer term, our goal was to connect each of these data categories to respective online databases (Google, Wikipedia, OpenWeather, Upcodes), in order to pull the required data. In the short term, we decided to start with the “Map” component to begin with, as a map feature would be the most visually appealing. We also saw a mapping application as an entry point into understanding geographic (GeoJSON) data, which we usually come across in GIS software.
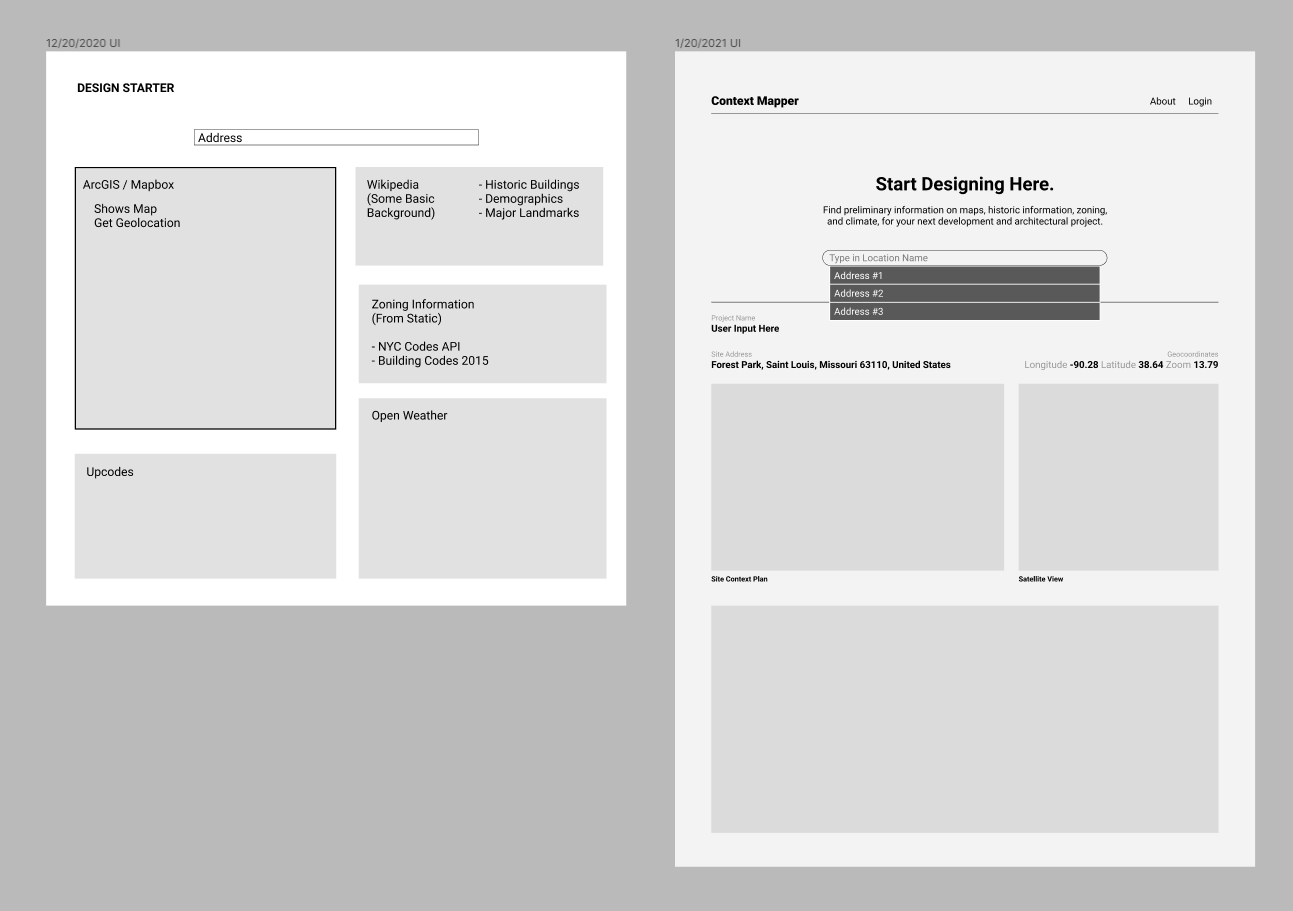
Initial Prototypes - From “Design Starter” to “Context Mapper”
After deciding on creating a mapping product, we investigated different types of mapping libraries available — ones that would be free to use and easy for novice developers to learn. Having reviewed the eye-watering entry-level fees for Google Maps, we decided to go with Mapbox instead. With the Javascript library Mapbox GL JS, we could easily plug in to Mapbox’s existing ecosystem and language for OpenGL, the industry standard Open Graphics Library for 2D/3D graphics on the web. Mapbox GL also allows us to utilize Mapbox Studio, which would allow us to customize the appearance of the map easily.
Technical Challenges
Technical Challenge #1: Initializing Map and Search x React Lifecycle
We encountered our first roadblock when trying to integrate Mapbox GL with our React boilerplate. As a library written in vanilla Javascript, Mapbox GL had no clear documentation regarding how it would play well with React states and JSX. We had to get intimately familiar with the library and also the inner workings of React.
After looking into some third-party plugins, we decided to maintain the original mapbox-gl component but place it within the proper context in React. Within our Mapbox.js script, we would initialize the map at the beginning of the component lifecycle (componentDidMount()) and then subsequently tear it down at the end (componentWillUnmount()). The vanilla JS portion of Mapbox GL inteface (initializing the map itself) would exist and live only within componentDidMount(), and other types of application functions would occur outside of it. While this approach may not be best practices, it allowed us to (1) focus on the core Mapbox GL library, (2) isolate distinct logic from each other, and (3) reduce the unwanted complexities of third-party codes.
Technical Challenge #2: Integrating Search (Geocoding)
Our next challenge was to connect our map interface with an address search query. Within the Mapbox API docs, Search, or Geocoding, is considered a separate product from Map. Fortunately, Mapbox provides a helpful controller plugin that allows you to use a Geocoder to drive the map. Once again, we connected and initialized the geocoder under componentDidMount() using vanillla JS. As we were on the “freemium” plan, the Geocoder allowed us to make 100,000 API requests a month (along with 50,000 free map loads), which is more than enough for our educational purposes.
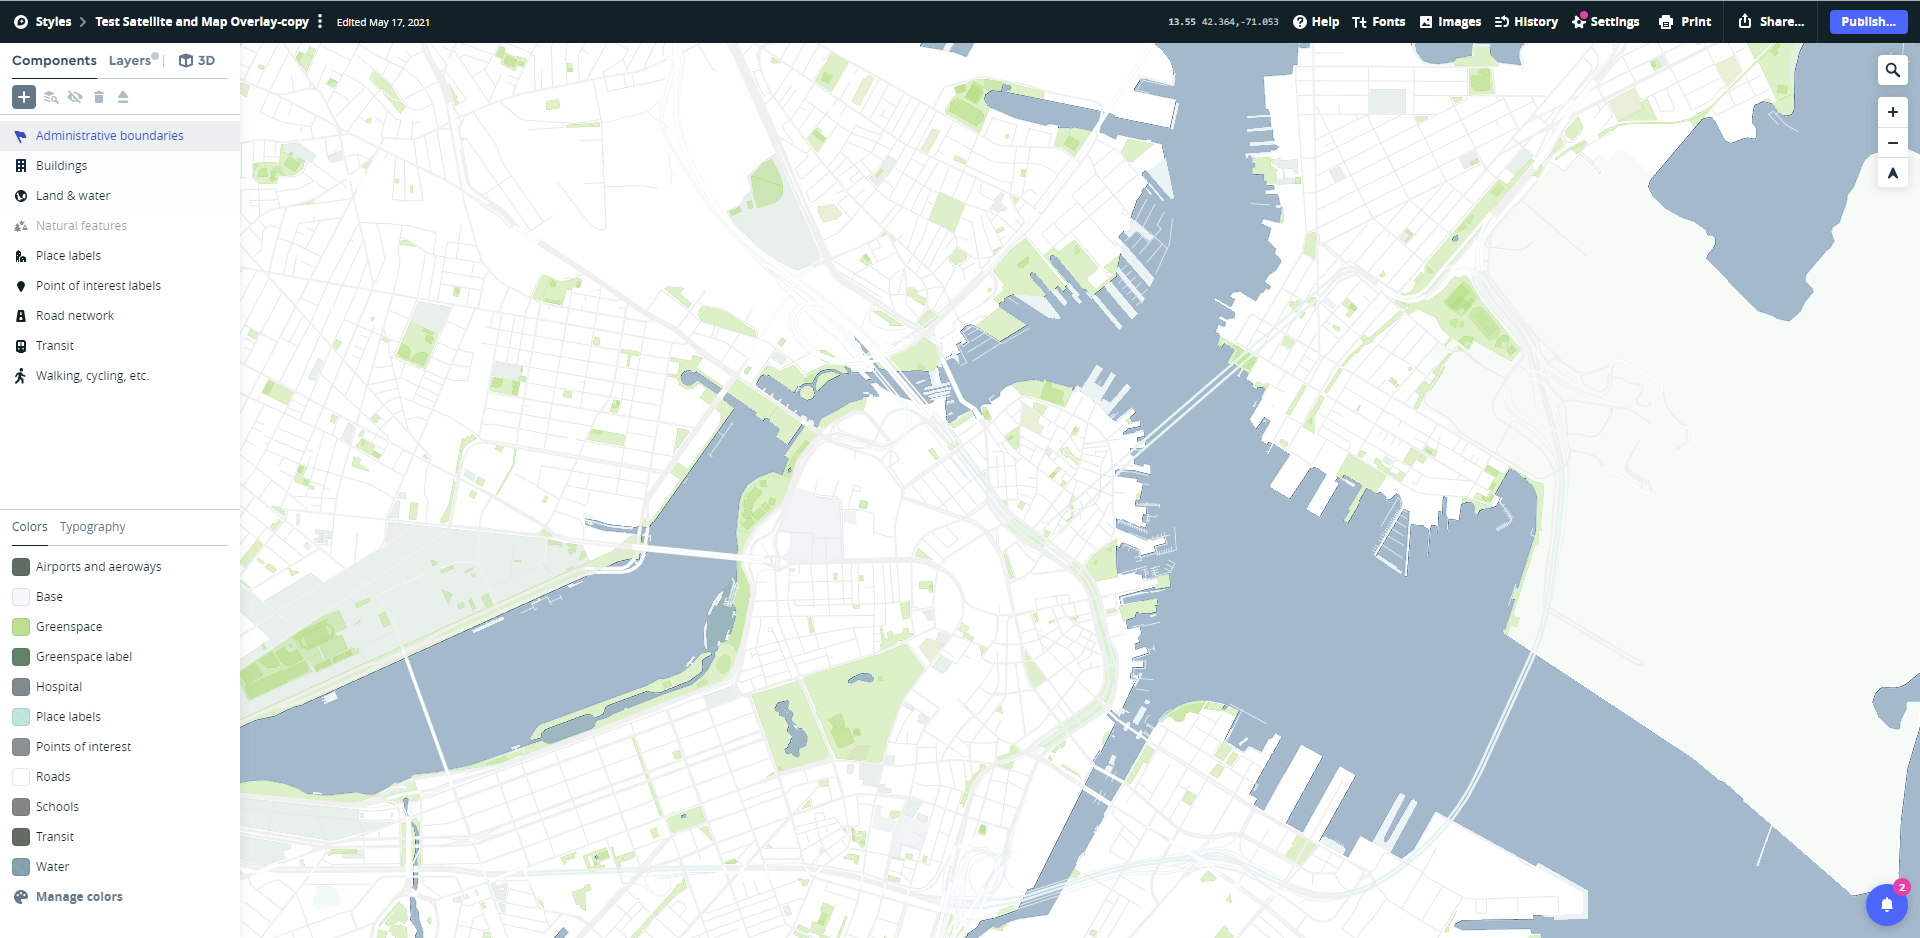
Mapbox Studio Interface
Technical Challenge #3: Interacting with Map I (Mapbox Studio)
Both the native Geocoder and Mapbox GL allows for simple pan and zoom features for map interactions. However, toggling map layers required additional work. It is common knowledge that Mapbox Studio provides an easy user interface for customizing the styling of web maps. However, it is really a graphic (GUI) interface to organize various information layers that generate the visual output of the map. For every map style, there is a corresponding backend JSON styling file that has a set of ordered information layers, categorized by information type (traffic, land use, buildings, etc.) and visual style (linetype, weight, color, visibility). With this information in mind, we can easily “toggle” on or off the visibility of particular layers on the map with simple UI buttons.
We selected the toggle layers based on our understanding of fundamental real estate and urban design drivers, as well as some basic user-friendly features:
Satellite View*
Topography (Site)
Subways & Rail Stations (Public Transit)
Text Labels (Street, Neighborhood, and Borough Names)
Parks and Land Use (Open Space)
(*Making the Satellite layer show up required a lot more testing and challenges than expected. Unlike the other map layers, which are often vector-based linework/information, the satellite view behaves differently, as it is comprised of graphic map tiles. The standard “boilerplate” map from Mapbox Studio does not technically include a satellite layer. After looking through GitHub forums, we developed a workaround in which we edited the JSON styling file to bring up the “satellite layer” to the front of the Map, and then loading it back to Mapbox Studio’s online tool to test for viability. Fortunately it worked. Throughout the development process, we would constantly tweak the map style in Studio to ensure that it was user-friendly and adhered to architectural best practices.)
Maps follow architectural graphic standards, compared to the navigation-oriented styling of products like Google Maps.
Technical Challenge #4: Interacting with Map II (Zoning Districts)
The next step was to allow NYC zoning district data to show up, via interactive toggles, on our map viewer. NYC GIS Zoning Features provides GeoJSON files that correspond to the global coordinates of each zoning district. Using python and Jupyter, Yiwen was able to parse the master file into individual JSON files categorized by zoning district type (C1, R1, R10, etc.). We were then able to upload each of the JSON files onto a “mock server” using github.io, then make REST API calls to this server each time a district is toggled. For the UI, we developed a simple color fill overlay and gradient system for each district type. For the overarching “C”, “M”, and “R” districts as a whole, we also created corresponding toggles that would outline all of the sub-districts contained within them.
Technical Challenge #5: Search Query and React State
The primary challenge – and the main reason for the app’s existence – is to connect the user address query to the Zoning Lot database. Thus, our primary user interaction sequence goes as follows:
User inputs an address (The Geocoder autofill identifies the correct address written in the right format)
User hits enter or the “enter” button.
The map viewer zooms towards the address, and the address lot appears.
The address lot data is visualized in supporting panels and/or hover boxes.
User can overlay the zoning district information or play with the map visualization toggles (secondary interactions)
At this point in the development, Yiwen and I were able to accomplish the first three items without failure (and also the last). However, we had still not connected the address to the zoning lot database. Looking through the NYC Open Data docs, we came across two technical options:
Download the .csv Zoning Tax Lot database files, similar to the method we used for districts, and convert the data into .json files. Create a mock server on github.io to store the files, where users can make API calls to.
Create API calls to the MapPLUTO via ArcGIS
Initially, we were hesitant to go with the second option, as we were more familiar with the more “static” approach of creating our own personal database. However, we soon realized that the Tax Lot Database contained infinitely more data points than just the 26 zoning districts in NYC, and that process would be unworkable. We then shifted to option #2, which turned out to be a lot simpler than expected. Essentially, users would be making API calls to a private ArcGIS account containing the MapPLUTO overlay information, rather than our mock public server on Github.io. This simplified our back-end processes, and it would also ensure that we would be accessing the most up-to-date data from the city.
Our front-end sequence works now as follows:
User inputs an address (The Geocoder autofill identifies the correct address written in the right format)
User hits enter or the “enter” button.
The address is saved to the React State.
The app makes an API call to MapPLUTO using the requested address query, and the returned data is saved to the React State.
The map viewer zooms towards the address, and the address lot appears.
The address lot data, saved to the React State, is visualized in supporting panels and/or hover boxes.
User can overlay the zoning district information or play with the map visualization toggles (secondary interactions)
When the user makes another address query, the previous state information is cleared and replaced by the new address and returned API data.
Design Challenge: The Interface
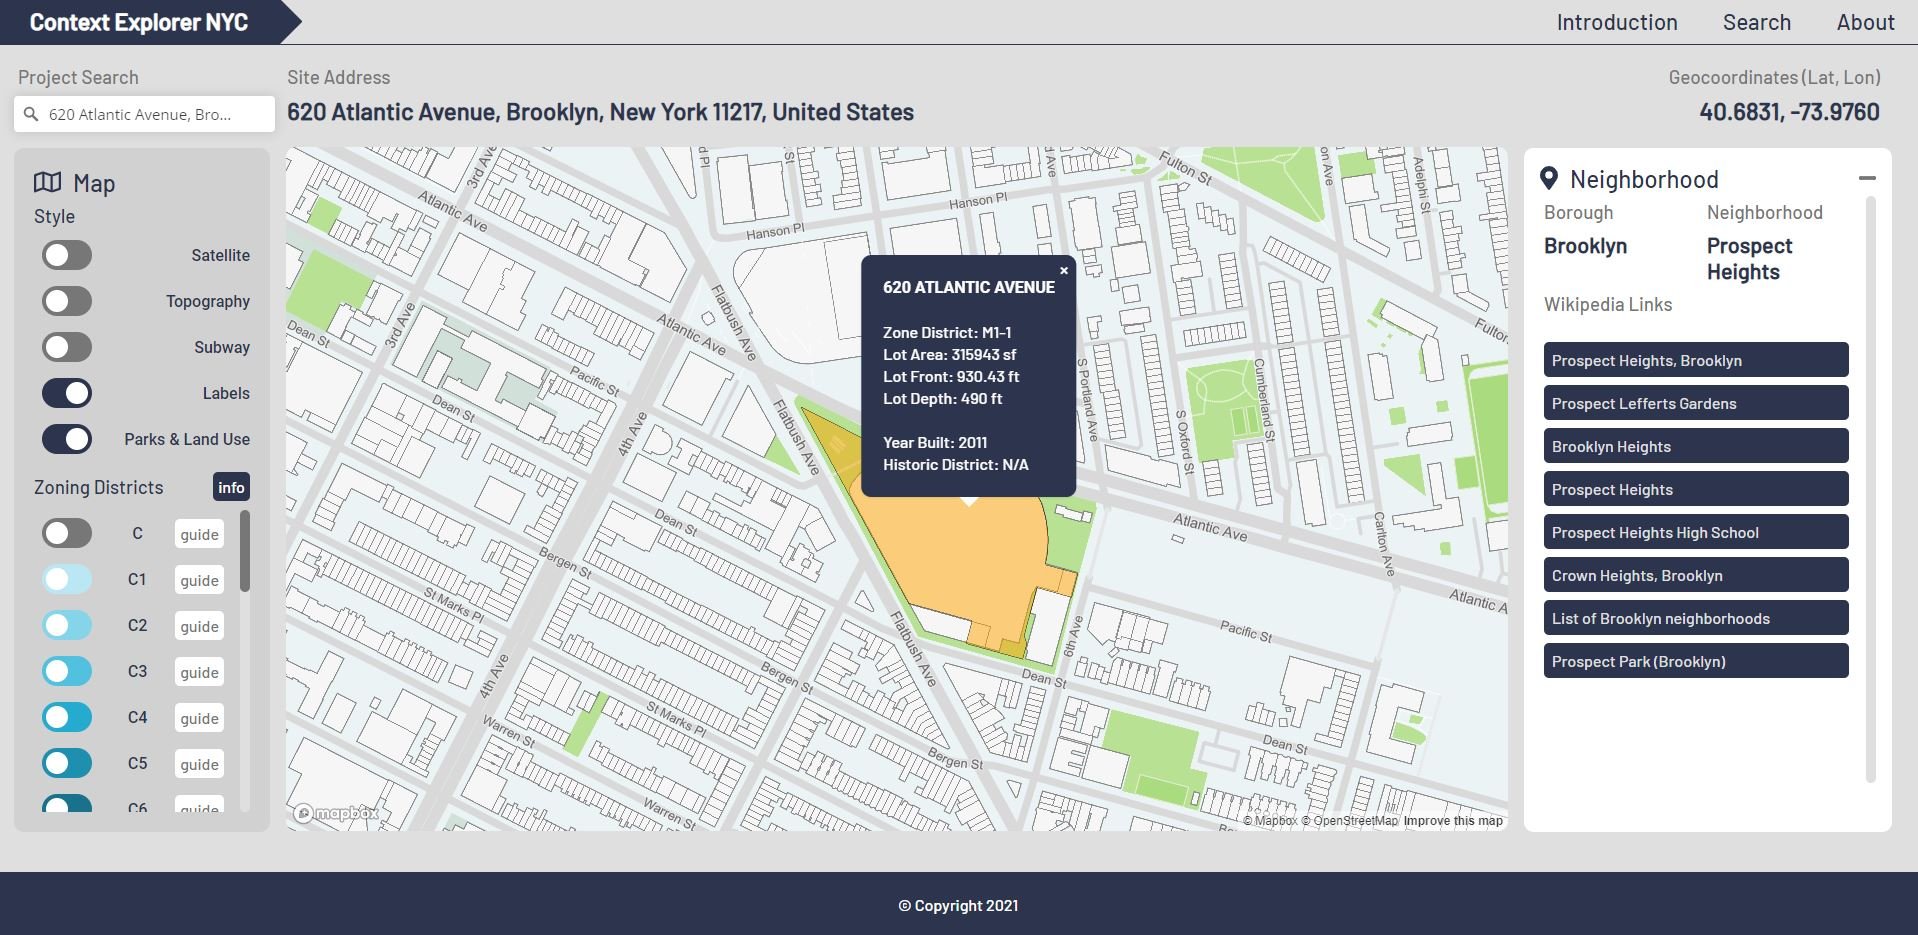
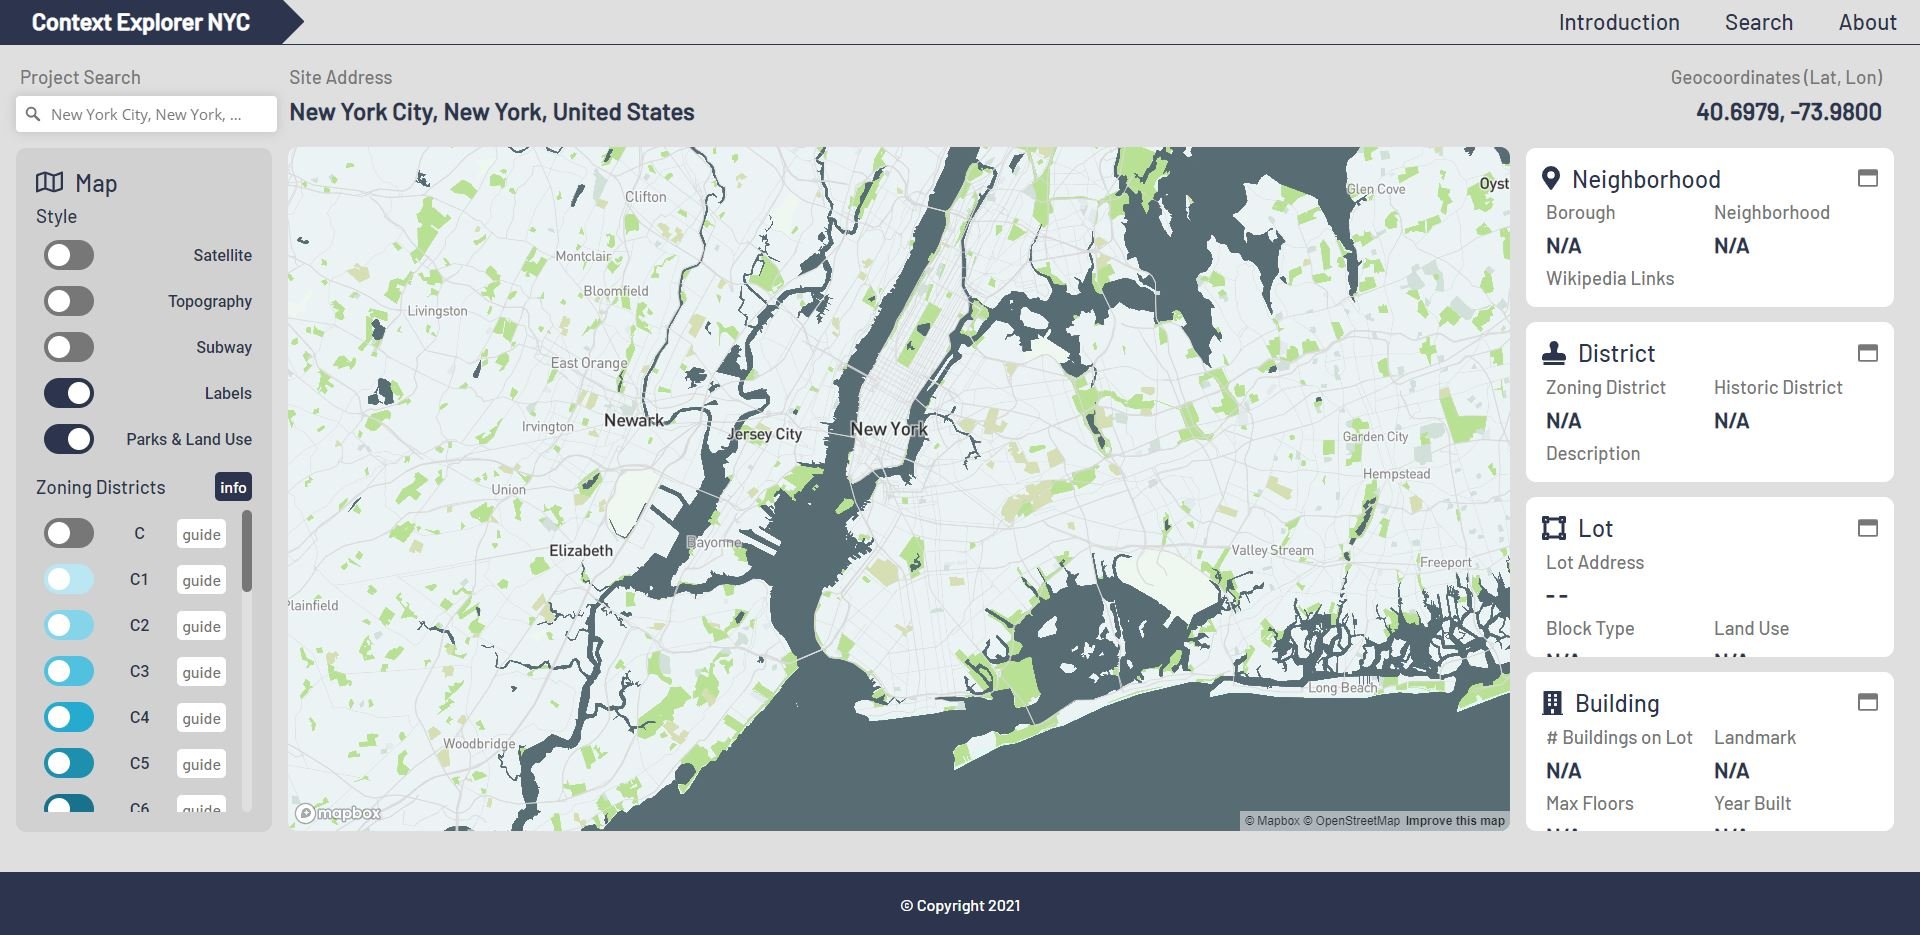
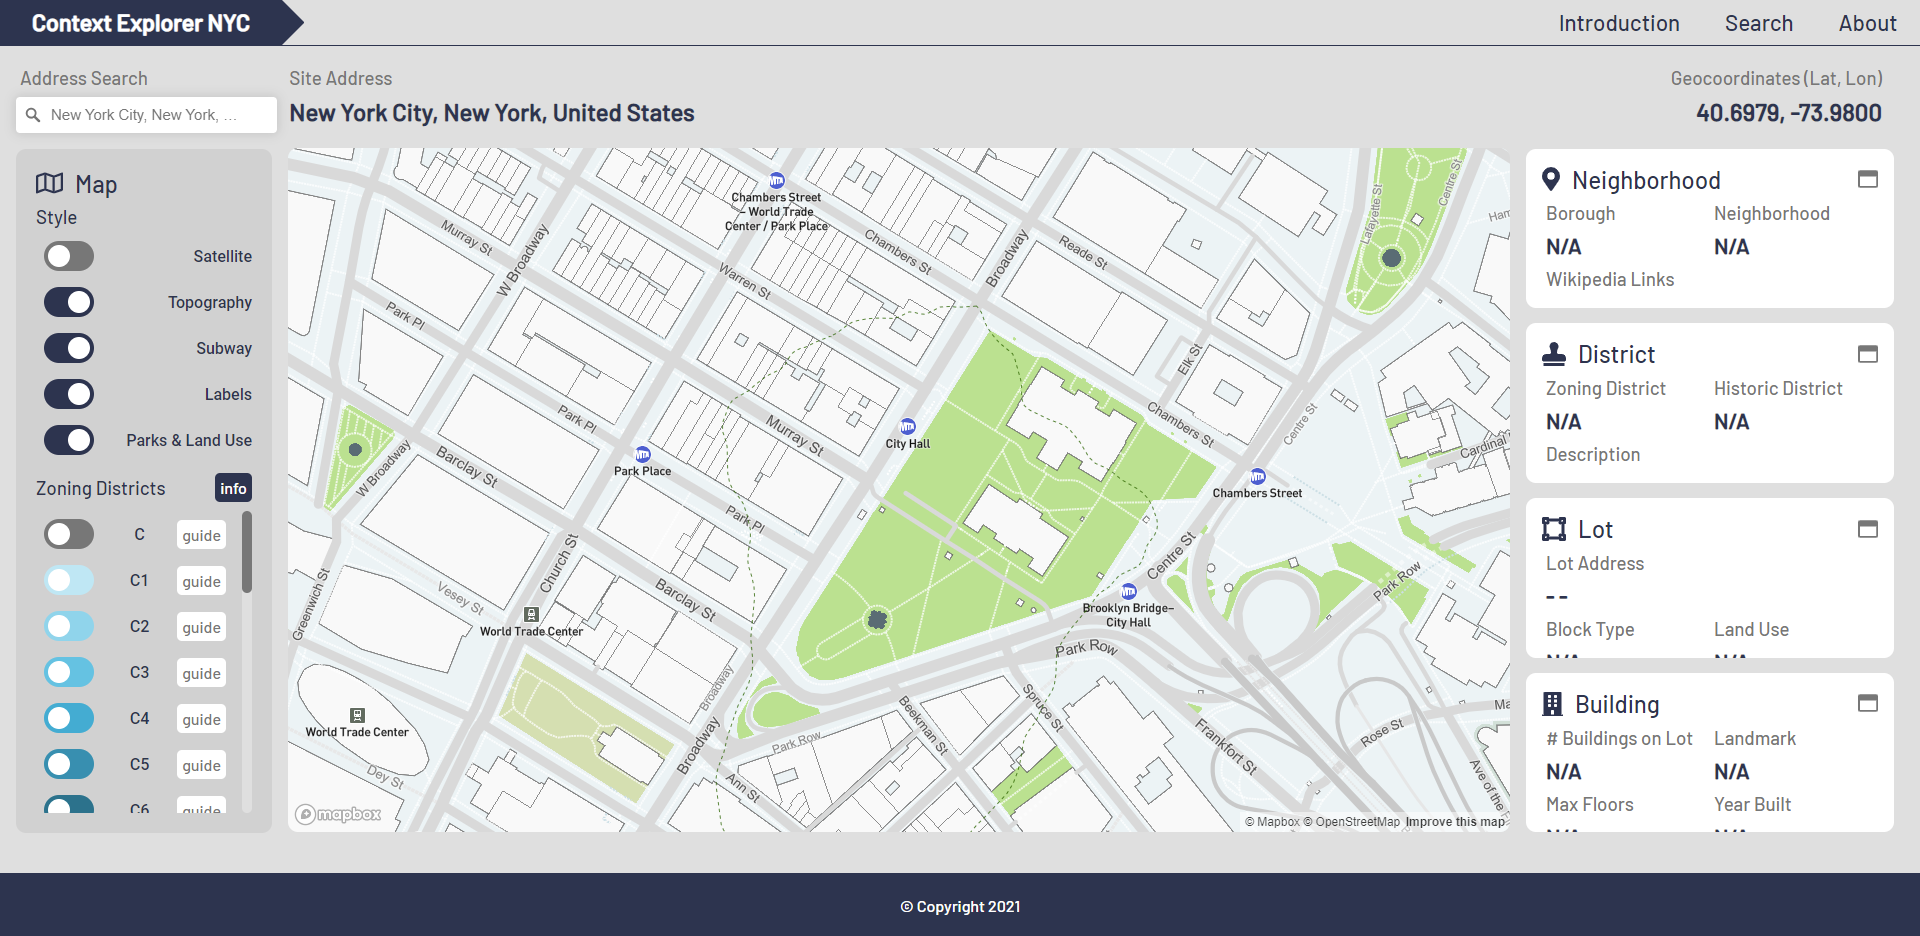
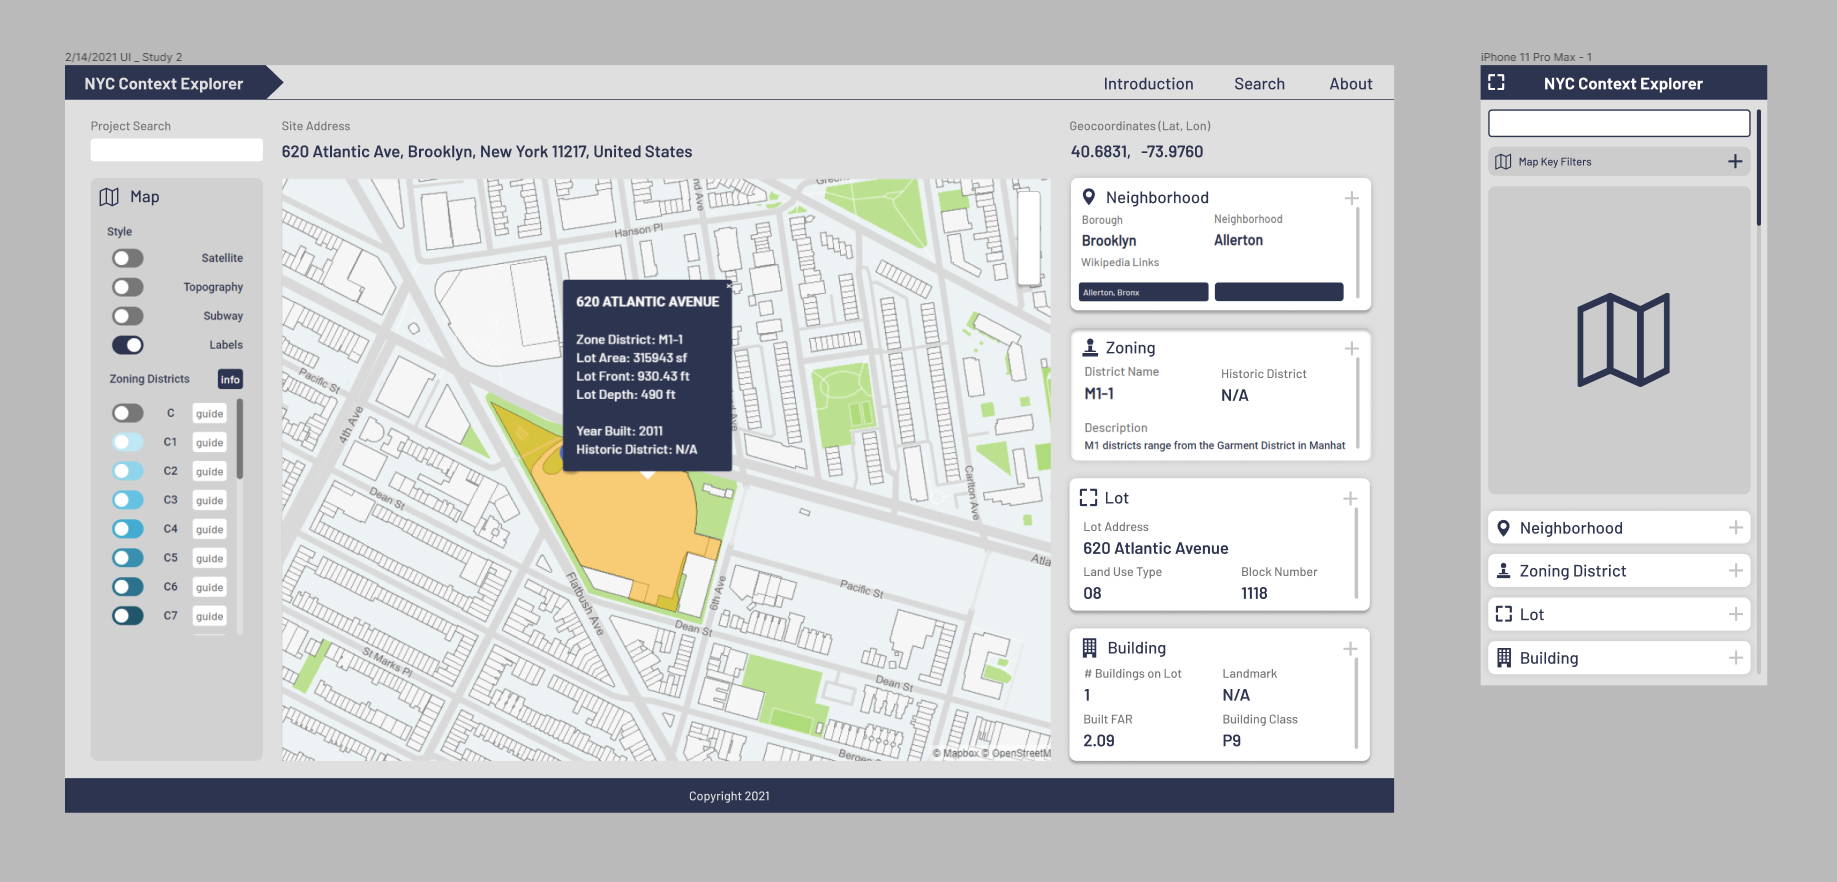
After resolving the technical challenge of the map, search box, and the map toggles, we finally moved on to designing and assembling the final UI. We adapted our initial vision of a set of informational panels, transitioning from showing a broad-based set of data (weather, climate, building codes) to information that is more specific to our zoning map.
Our initial vision consisted of a set of informational panels that would categorize the information by “scale” – in architectural speak.
Neighborhood
Zoning
Lot
Building
We still had our initial vision of a set of informational panels that would show up after a search query. (TBD)
Technical Challenge #5: Other Panels and Information
(In Progress)
Technical Challenge #6: Mobile Responsiveness
(In Progress)
Code Structure
The Waterfall
(In Progress)